Skip to content
Home
Key Features
Key Features
🔢 Table Display
🔍 Dynamic Filtering
✏️ Inline Editing
🔗 Sub-Records
🎨 Conditional Coloring
∑ Aggregations
➕ Totalize
📤 Export
Documentation
Contact
Log in
Country/region
Canada | CAD $
Canada
CAD $
United States
USD $
Language
English
English
Français
Home
Key Features
🔢 Table Display
🔍 Dynamic Filtering
✏️ Inline Editing
🔗 Sub-Records
🎨 Conditional Coloring
∑ Aggregations
➕ Totalize
📤 Export
Documentation
Contact
Search
Log in
Cart
Item added to your cart
View cart
Check out
Continue shopping
Elevate Salesforce UX
Customizable, Excel-like tables inside Salesforce.
Filter
,
Edit
,
Format
, and
Explore
data
with ease
.
Get it on AppExchange
🛠️
Easy Setup
Deploy SKIN in your Org
Add our Lightning Web Component (LWC) to any Flexipage
Configure LWC parameters
Works with any objects
Enjoy!
Quick Demo
🛠️
Easy Setup
⛶
×
Key Features
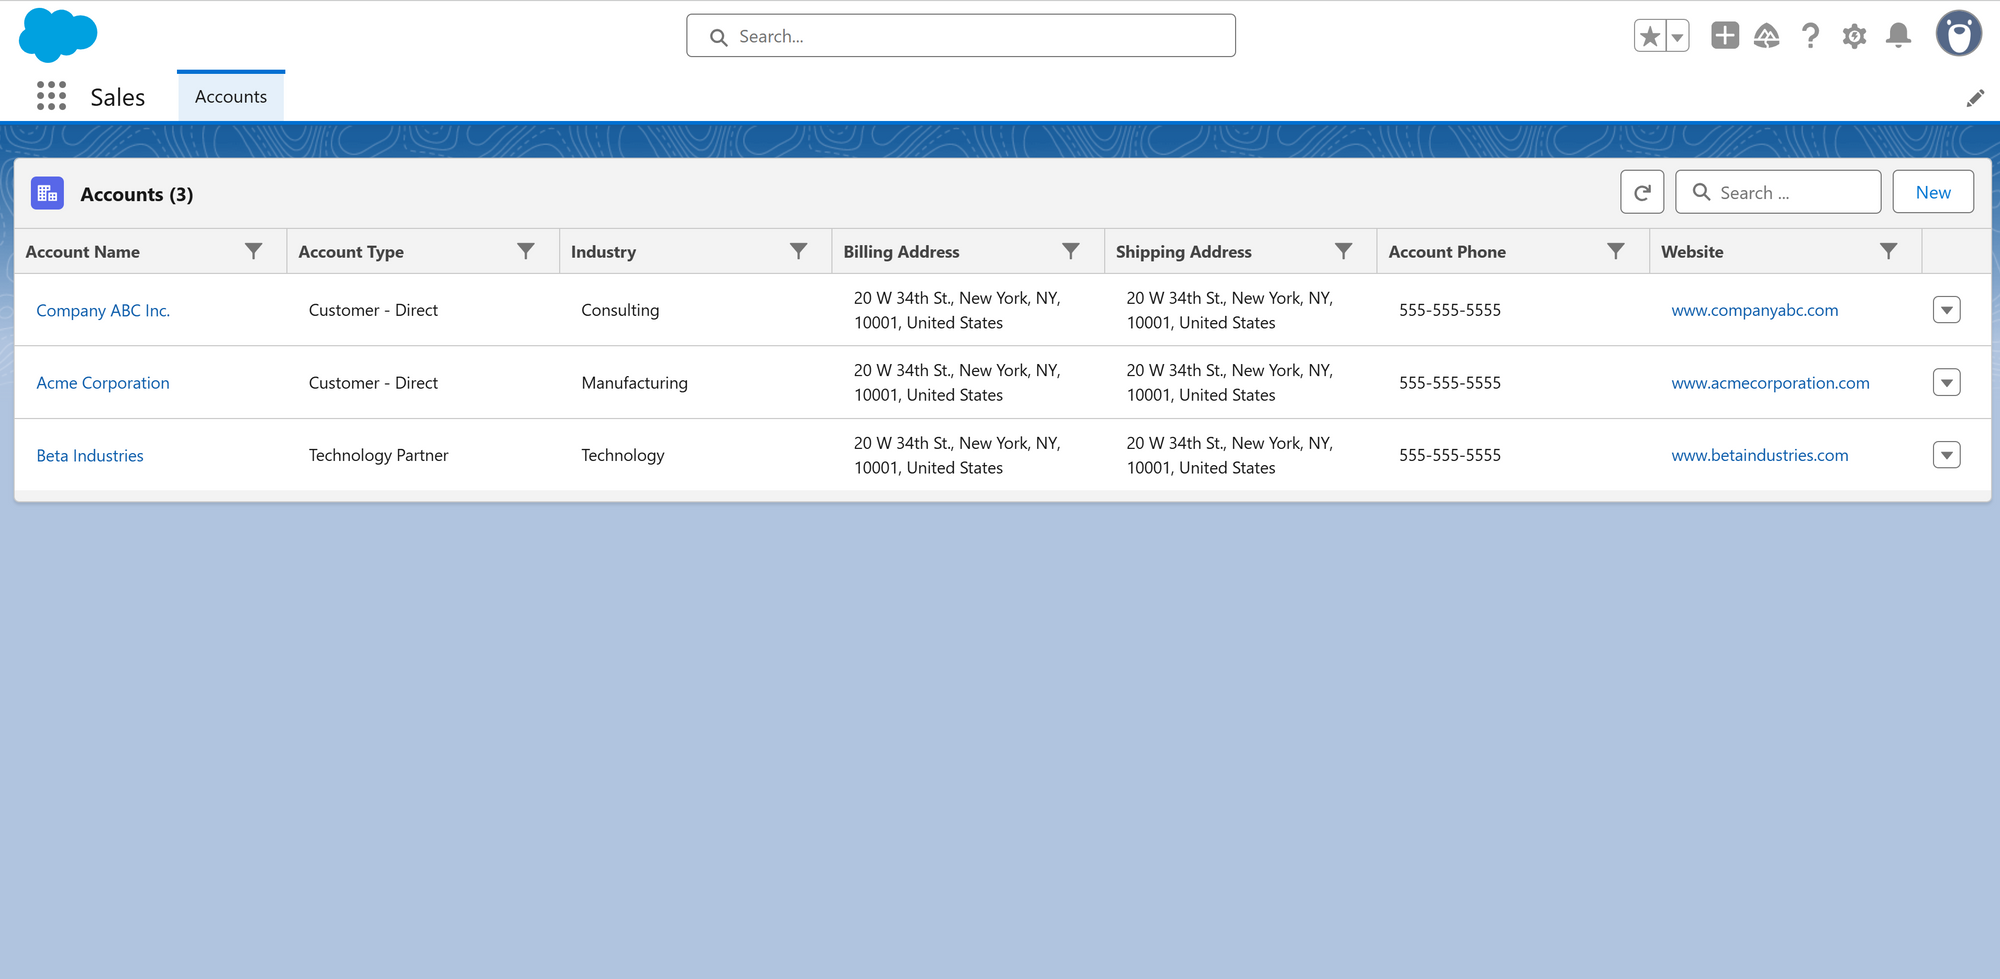
🔢
Table Display
Set icons, colors, and titles
Display any fields
Adjust columns width / wrap text
Display few or unlimited records
Quick Demo
Learn More
🔍 Dynamic Filtering
Apply filters instantly
Combine multiple conditions
Save filter presets
Switch views on the fly
Quick Demo
Learn More
✏️
Inline Editing
Edit directly in the table
Mass update records
No page reload
Admin-controlled access
Quick Demo
Learn More
🔗 Sub-Records
Display related records inline
Expand/collapse details
Quick navigation to child records
Cross-object visibility
Quick Demo
Learn More
🎨 Conditional Coloring
Color rows/columns by value
Highlight exceptions
Easy data scanning
Rule-based formatting
Quick Demo
Learn More
∑
Aggregations
Sum, average, min, max
Real-time updates
Multi-level grouping
Supports numeric fields
Quick Demo
Learn More
🟰
Totalize
Totals at top of columns
Auto-calculated on filters
Supports currency/percent
Improves reporting clarity
Quick Demo
Learn More
📤
Export
Export table to Excel/CSV
Preserve filters & sorting
Share outside Salesforce
One-click simplicity
Quick Demo
Learn More
🔢
Table Display
⛶
×
🔍 Dynamic Filtering
⛶
×
✏️
Inline Editing
⛶
×
🔗 Sub-Records
⛶
×
🎨 Conditional Coloring
⛶
×
∑
Aggregations
⛶
×
🟰
Totalize
⛶
×
📤
Export
⛶
×
Choosing a selection results in a full page refresh.
Opens in a new window.